The Performance Dashboard provides you with insights into your property's success with OneApp Guarantee. This dashboard tracks key performance metrics, including incremental revenue, default claims, payouts, and conversion performance.
See the full overview below, but if videos are more your thing, here's a quick walkthrough.
Accessing the Dashboard
-
In your OneApp Guarantee account, click the Dashboard tab on the left navigation bar.

🏆 Pro Tip: Get key performance insights right in your inbox, so you can stay informed with as little effort as possible. Learn more about automated reports.
Key Metrics
ROI Using OneApp Guarantee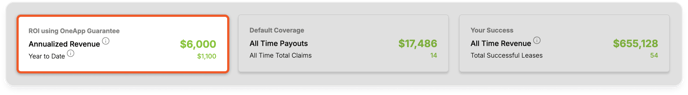
- Annualized Revenue: Projected revenue for all guarantees that are currently active, excluding defaults.
- Year-to-Date: Revenue generated for all guarantees issued year to date.
Default Coverage
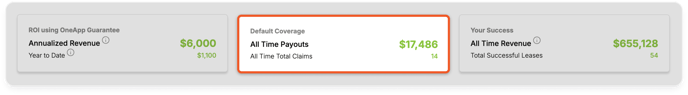
- All Time Payouts: Default protection provided by OneApp Guarantee.
- All Time Total Claims: The number of default claims submitted to OneApp Guarantee.
Your Success
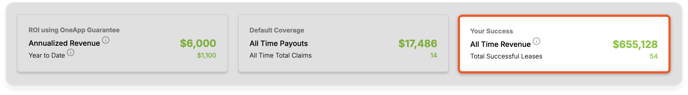
- All Time Revenue: Revenue generated for all guarantees, excluding defaults.
- Total Successful Leases: Guaranteed leases that have been completed successfully.
Performance Reports
Guarantee Conversion Performance
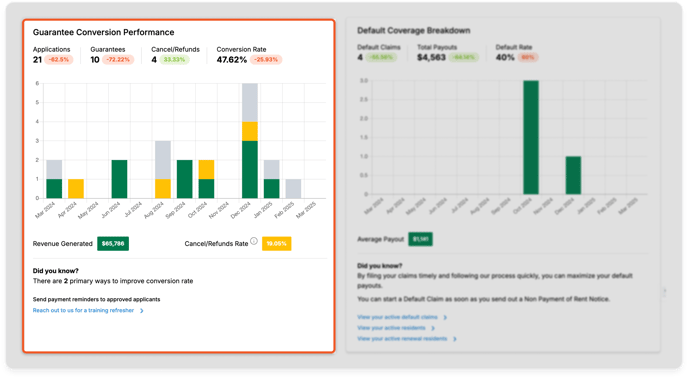
- Applications Submitted: Number of referrals who submitted applications.
- Guarantees Issued: Number of guarantees issued to applicants you've referred.
- Cancellations / Refunds: Number of applications that were cancelled and/or refunded.
- Conversion Rate: Percentage of applicants you referred who converted into residents.
- Revenue Generated: Total revenue driven by OneApp Guarantee for the property.
Default Coverage Breakdown
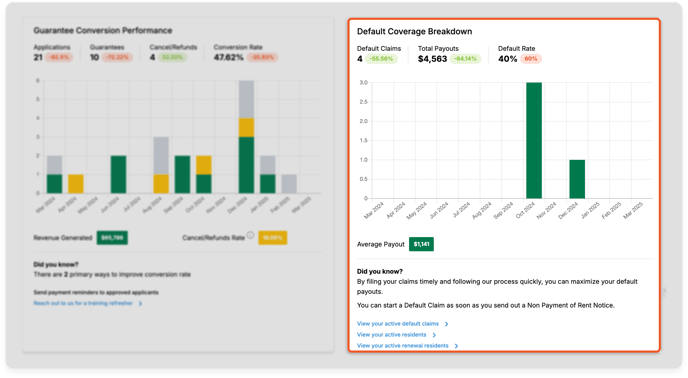
- Default Claims: Number of default claims submitted.
- Total Payouts: Amount of default protection paid.
- Default Rate: Percentage of OneApp Guarantee residents who defaulted.
Download the Dashboard
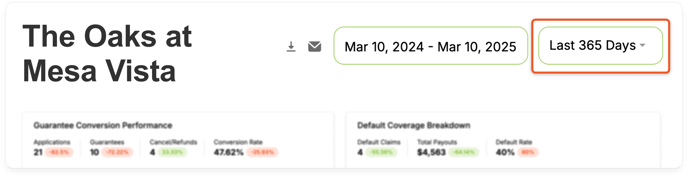
- Use the date selector to select specific start and end dates for your reports.

- You can also use the dropdown to select a predefined reporting period:
- Last 365 Days: Performance from today's date for the last 365 days.
- YTD: Performance for the current year to date.
- Last Quarter: Performance for the previous quarter.
- MTD: Performance for the current month to date.
- All Time: Performance for the duration of the partnership.
- Click the download icon.

Share the Dashboard
- Select the specific time period for the reports you want to share.
- Click the email icon.

- In the pop-up window, enter the email address you'd like to send the dashboard to.
- Click Send.